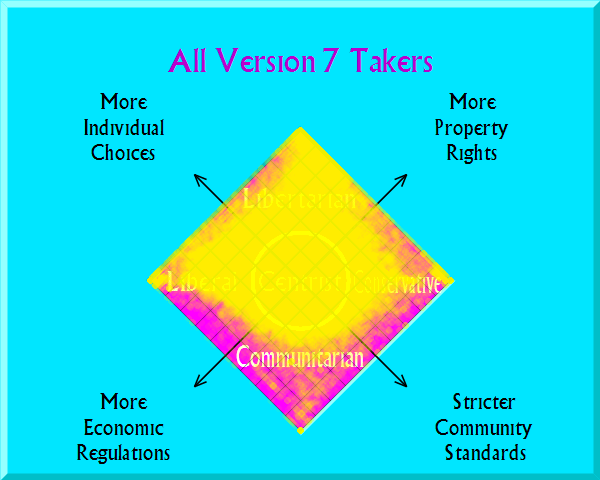
After a few months leaving things alone, I have finally gotten around to tabulating the latest results from Version 7 of the Quiz (released in August 2012). A quick look at a scatter plot indicates that the Quiz is now reasonably normalized:

Yes, there is a cluster in the Libertarian quadrant, but this is to be expected for several reasons:
- The Nolan Chart does look at the political map from a libertarian perspective. Libertarianism thus shows up as the most coherent ideology by this mapping.
- The libertarian movement has done the most to promote quizzes such as this, so more of the takers of this quiz have been prompted to do so by libertarians. Indeed, the earliest links to this site were Libertarian Party affiliates.
- Political quiz takers in general will tend to be taken more by those unhappy with the two major party offerings.
- A sizable fraction of the traffic today comes from school sites. Young people destined to become Republicans tend to score more libertarian than conservative. Whether they will become more socially conservative as they grow older remains to be seen.
Then again, it is possible that libertarianism — broadly defined — is a growing faction in this country and currently underrepresented in our legislatures. Given the non random nature of this data sample, the scatter plot above should not be taken as strong evidence for this assertion, though.
The more detailed statistics, however, should be more useful for determining how libertarian young and/or independent voters are willing to be. (They can be used as for how conservative, liberal, communitarian, etc.) There is significant clustering in the center of the graph, so the specific answers may reveal some deal-killers for all factions.
The strongest smaller-government signal is for the issue of marijuana legalization. 60% of the quiz takers say we should legalize marijuana outright. Another 18% believe we should make marijuana less illegal than it is today, either by decriminalizing recreational use or by making medical marijuana legal.
On the other hand 56% of the Quiz takers believe we should continue keep our laws against harder drugs and/or increase enforcement. This is despite the fact that the Quiz grants users many incremental options between the status quo and outright legalization.
The strongest signal for bigger government comes from the Public Education question. There is strong support for increasing public school funding and graduate school educations for teachers. A mere 16.6% of takers favor some form of school privatization (vouchers, tax credits or simple public school abolition). Those who favor school choice have an uphill battle, at least with the Quiz2D demographic (which includes many students currently in public schools).
A few more highlights:
- ObamaCare and/or outright socialized medicine has strong support.
- Nearly 40% of Quiz takers believe we should legalize prostitution.
- The Second Amendment still has strong support, though nearly a quarter of the takers believe we should have stronger background checks for pistols and semi-automatic rifles.
- Over half the takers believe in some additional immigration restrictions.
- There is a strong sentiment towards scaling back or privatizing Social Security over time.
Peruse the statistics yourself.


